2023 Year-End Currency Hedging: Navigating FX Fluctuations During the Holiday Season

As the holiday season comes into swing, attention may shift away from managing foreign exchange exposures. Still, our analysis shows that this period of the year should be treated with the same vigilance as any other period.
In this research piece, GPS delves into an analysis of the most actively traded currency pairs, including EUR/USD, GBP/USD, AUD/USD, USD/CAD, and USD/MXN over the period of 10 December to 10 January. The analysis is divided into two parts: an initial examination of the Spot market followed by a detailed exploration of market volatility.
SPOT MARKET ANALYSIS
To facilitate easier comparison of movements, the first series of charts show the percentage movement using 10th December as a base for each year. The graphs show seasonal trends, with each year displayed as a separate line.
EUR/USD
In the context of EUR/USD during this time, the Spot rate increased by 1.86% last year and 1.27% in 2018/19. It’s evident from the data that the movements occurred in both directions with more pronounced intra-month fluctuations.
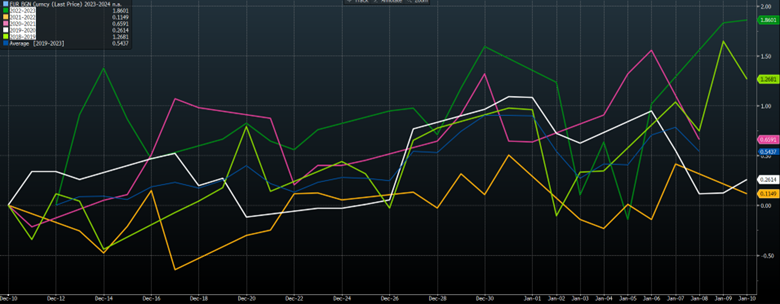
Source Bloomberg: EUR/USD percentage movement since 2018.
GBP/USD
During the same timeframe for GBP/USD, Spot increased by 2.29% in 2021/22 and 2.05% in 2020/21. The moves can be seen in both upward and downward directions, with last year experiencing a 0.93% decrease in the Spot rate between the two dates. These percentage moves translate into more points in this currency pair. Intra-month moves were highlighted last year when the Spot rate fell over 4% from the high, followed by an early New Year rally of 2%.
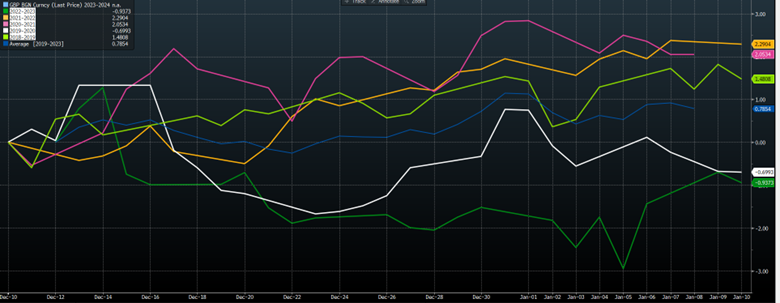
Source Bloomberg: GBP/USD percentage movement since 2018.
AUD/USD
The AUD/USD pair experienced large swings during this period. Notably, there was a 2.95% increase in the Spot rate in 2020/21 and a 2.13% rise last year. The moves were observed in both directions, particularly leading into the year-end. Intra-month movements were particularly evident last year when the Spot fell over 3% from its highest point, followed by a 3% rally at the start of the New Year.
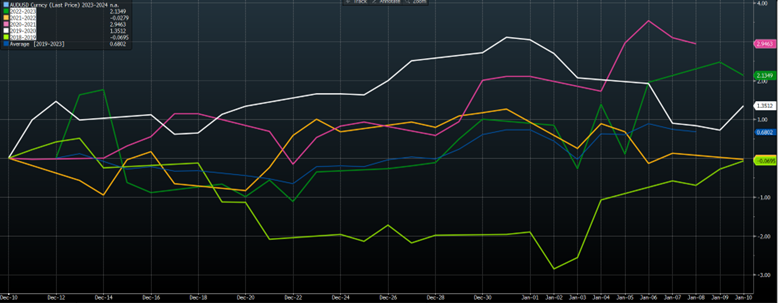
Source Bloomberg: AUD/USD percentage movement since 2018.
USD/CAD
During the observed period, USD/CAD exhibited significant fluctuations, more than is justified by this pair’s currency’s low implied volatility. In 2020/21, the Spot rate increased by 0.29%, whereas it fell by 1.54% last year. These changes can be seen in both directions, particularly leading into the year-end. A prime example of Intra-month volatility was in 2018/9, when the Spot rate rallied over 1.7%, followed by a 3% fall at the beginning of the New Year.
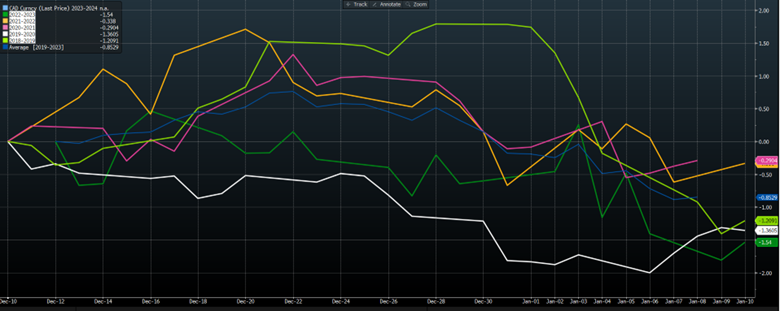
Source Bloomberg: USD/CAD percentage movement since 2018.
USD/MXN
There were notable large swings for USD/MXN over the same timeframe. There is an evident bias for a lower Spot (indicating a stronger MXN).
In the 2018/19 period, the Spot rate fell by 5.82% and declined by 3.97% last year. Given the higher implied volatility of USD/MXN and a stronger bias towards USD calls, these can be used to mitigate the seasonal tail risk associated with these movements.
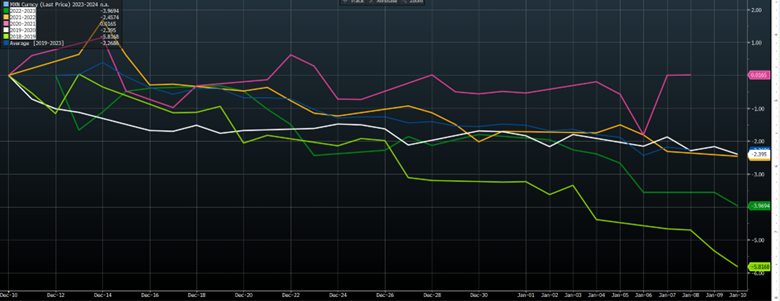
Source Bloomberg: USD/MXN percentage movement since 2018.
VOLATILITY ANALYSIS
The second notable seasonal trend we see is the market’s tendency to underestimate the expected movement during this time, as shown by the lower implied volatility levels. To demonstrate this, we created seasonal volatility spread charts comparing the 1-month realized (historical volatility) with the implied volatility. This phenomenon typically manifests in a three-stage trend:
- In early December, the market consistently underestimated the movement by pricing the volatility in the 1-month ahead (implied) lower than that displayed over the last month (realized).
- This differential narrows into a year, driven by a pickup in implied or lower realized volatility. Remember, a straight-line move has a low variation of returns (realized volatility).
- The significant moves into the New Year (often reversals) increase the realized volatility level.
What is the difference between realized and implied volatility?
Realized Volatility is the actual movement experienced by the market. Implied Volatility is the volatility derived from the market-traded options for a given maturity.
EUR/USD
The trend is evident in EUR/USD volatility, where a U-shaped pattern emerges (see the blue average line). Last year was a prime example, where the Spot at the beginning of the year led to a recovery in realized volatility.
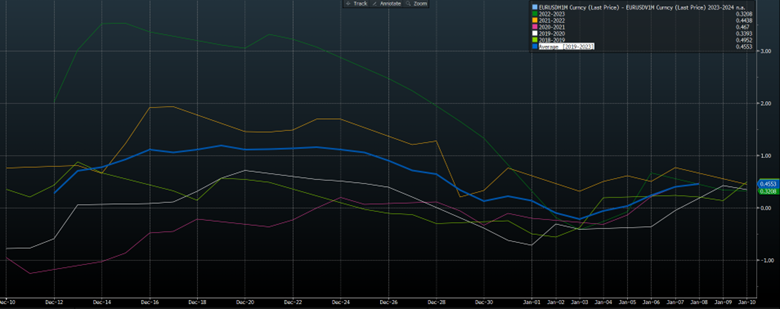
Source Bloomberg: EUR/USD 1-month realized volatility minus 1-month implied volatility since 2018.
GBP/USD
In the case of GBP/USD volatility, the trend is less visible due to the significant impact of Brexit negotiations during 2018/19 and 2019/20. However, the trend was more noticeable on this chart in the last year.
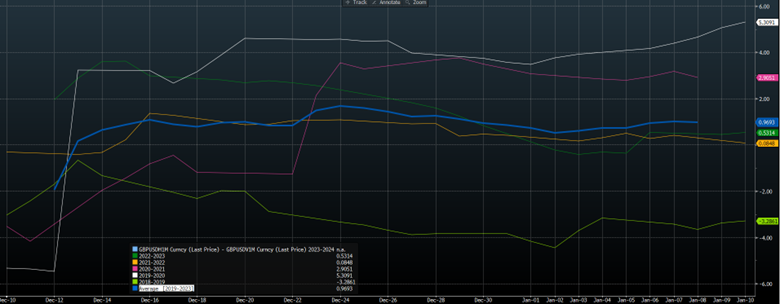
Source Bloomberg: GBP/USD 1-month realized volatility minus 1-month implied volatility since 2018.
AUD/USD
The trend is observable in the AUD/USD volatility, where the U-shaped pattern emerges as indicated by the blue average line on the chart. While 2020/21 appears to be an exception, last year served as a prime example, where the reversals in the Spot rate at the start of the year led to a recovery in realized volatility.
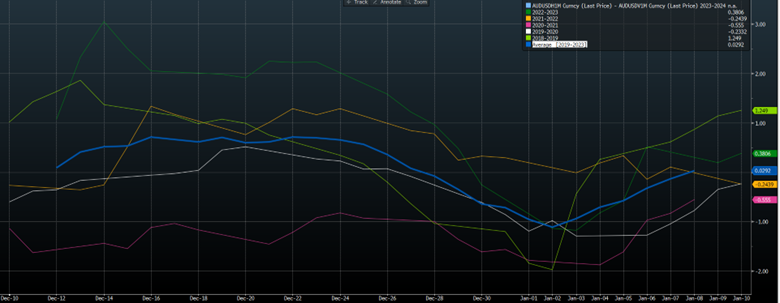
Source Bloomberg: AUD/USD 1-month realized volatility minus 1-month implied volatility since 2018.
USD/CAD
In the case of USD/CAD volatility, the U-shaped pattern emerges (see the blue average line on the chart). The 2018/19 period stands out as a prime example of this trend, where the reversals in the Spot rate at the start of the year caused a recovery in realized volatility.
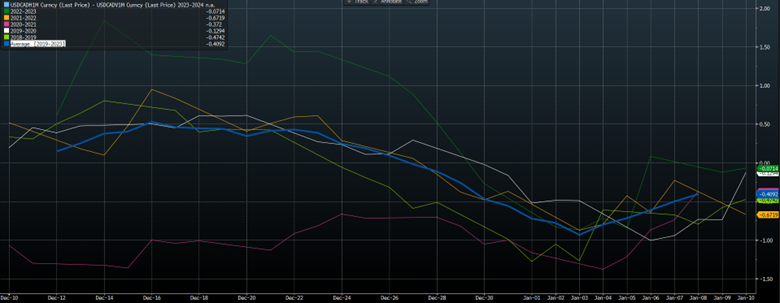
Source Bloomberg: USD/CAD 1-month realized volatility minus 1-month implied volatility since 2018.
USD/MXN
Although the spot charts show good spot movement in USD/MXN, the fact that these moves were closer to linear means that the realized volatility will not be as high as an equivalent amount of whippy price action. The trend mentioned can be seen in the years where the Spot rate moved significantly (2018/19 and 2022/23).
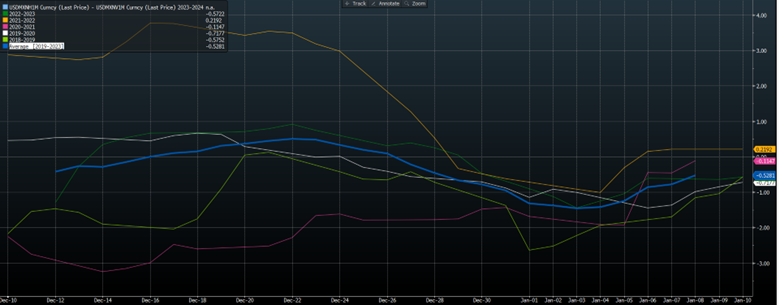
Source Bloomberg: USD/MXN 1-month realized volatility minus 1-month implied volatility since 2018.
CONCLUSION
This research piece is not designed to predict where the currencies will go between now and the start of 2024. There are three conclusions to draw from the research:
- The analysis shows that the spot market does move between the early December and early January periods, so it would be wise to have exposures covered.
- The data shows market price options too low over the period (traders dislike time decay over perceived quiet markets being the prime reason).
- Based on the point above and implied volatility currently well below 5-year averages, it makes sense to consider a structured hedge that allows some participation and the chance to outperform.
GPS Capital Markets provides corporate foreign exchange services to help companies manage foreign currency risk and execute foreign currency transactions.
Clients across the world trust GPS to minimize their FX risk and grow their international business by combining competitive exchange rates and our award-winning FXpert® platform with a host of tailored international financial solutions, including Intercompany Netting, Hedge Accounting, Balance Sheet Hedging, cross border payments, Data Analytics, and Cash Flow Hedging. For more information, book a call with one of our expert advisors.
This document is for information purposes only and does not constitute any recommendation or solicitation to any person to enter into any transaction or adopt any trading strategy, nor does it constitute any prediction of likely future movements in exchange rates or prices or any representation that any such future movements will not exceed those shown on any illustration. All exchange rates and figures appearing are for illustrative purposes only. You are advised to make your own independent judgment with respect to any matter contained herein.

