Anticipated Surge of Cross Currency Movement
SUMMARY
Throughout 2022, the major currencies became closely correlated as the US dominated market movements. This was driven by the Fed’s tightening of monetary policy, with other countries following suit. We can see in the chart below, the USD strengthened against all major currencies and as a result there were limited movements in cross currencies. By cross currencies, we mean any pair not quoted against the USD such as, EUR/CAD, EUR/GBP, EUR/AUD and AUD/JPY. The correlations with the USD peaked in early 2023 and are starting to breakdown.
This can be explained simply in fundamental terms. In 2022, the USD strengthened against all currencies in an almost uniform trend. In 2023, what we are seeing is that there is divergence in levels of inflation across economies and the subsequent expectations on monetary policy. The slowdown in China, other factors such as commodity prices and domestic factors are having an asymmetric effect on each economy, causing a reversal of these correlations. Movement can be seen in cross currencies, and we expect this trend to continue in the months ahead.
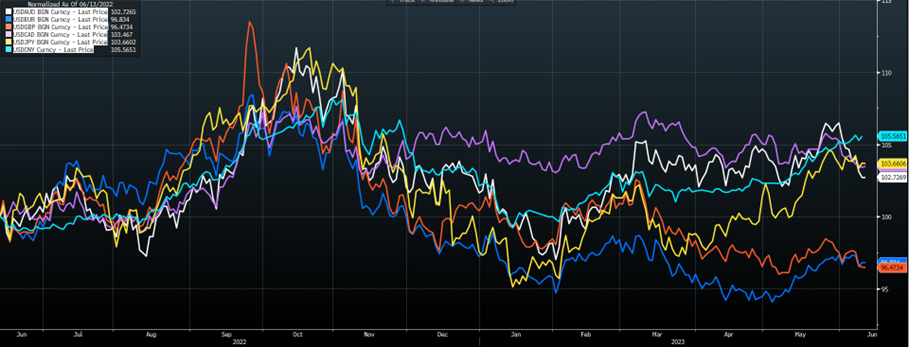
Spot currencies of EUR, GBP, CAD, JPY, CNY and AUD against the USD over the last year. Movements use a base of 100 as of a year ago and a movement higher denotes a stronger USD.
ANALYSIS
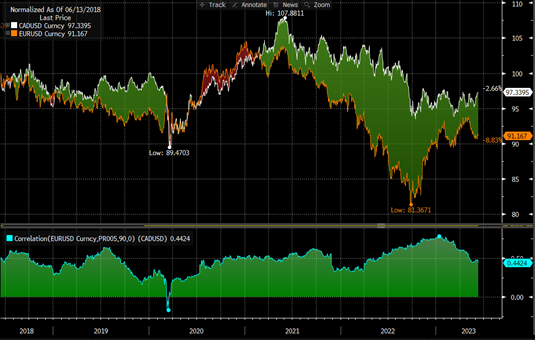
The top section of this chart shows percentage movement in EUR/USD and CAD/USD over the last 5 years (base 100). The bottom pane shows a rolling 90-day correlation, which peaked at the start of 2023 and is trending lower.
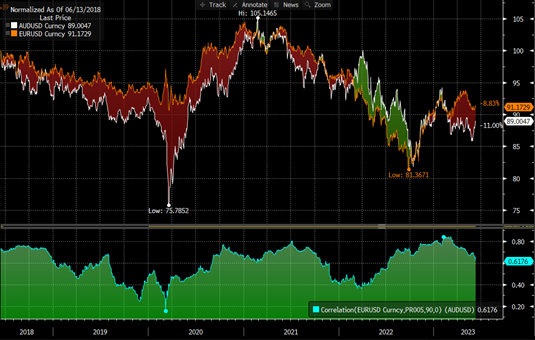
The top section of this chart shows percentage movement in EUR/USD and AUD/USD over the last 5 years (base 100). The bottom pane shows a rolling 90-day correlation, which peaked at the start of 2023 and is trending lower.
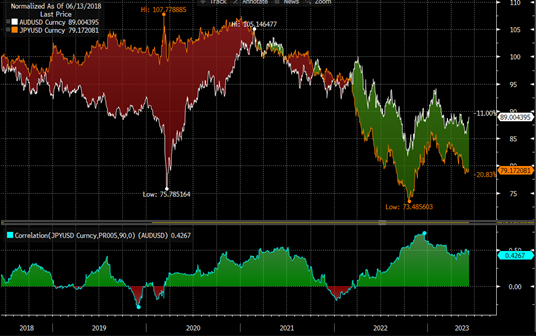
The top section of this chart shows percentage movement in JPY/USD and AUD/USD over the last 5 years (base 100). The bottom pane shows rolling 90-day correlation, which peaked at the start of 2023 and is trending lower.
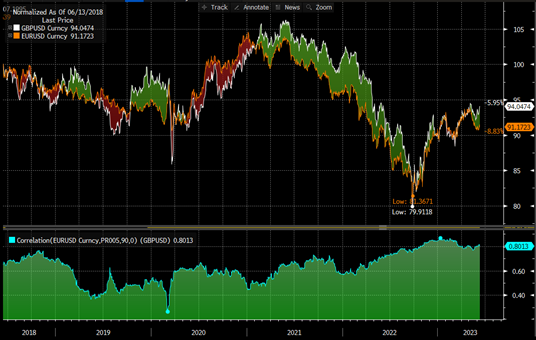
The top section of this chart shows percentage movement in EUR/USD and GBP/USD over the last 5 years (base 100). The bottom pane shows rolling 90-day correlation. The correlation of these pairs is traditionally high but, history includes Brexit negotiations. Correlation has moved lower in 2023.
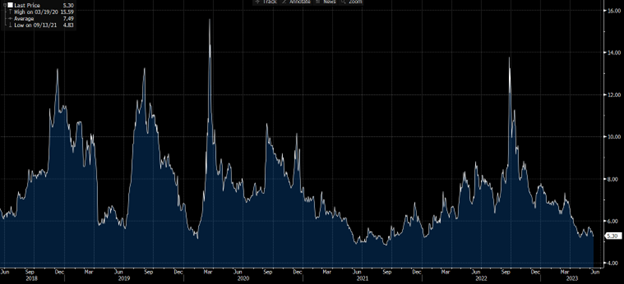
Implied (market traded) 3-month volatility in EUR/GBP over the last 5 years. The high correlation between EUR and GBP and lower volatility in EUR/USD and GBP/USD translate in a low volatility, which make buying options an appealing hedge.
In the months ahead more movement in cross currencies is expected, so please pay close attention to any open exposures. If you have exposures in any of the cross currencies, make sure you pay attention to your hedges closely. If you do any kind of triangulation on exposures this may be a time to revisit that process, given how the currency movement has significantly detached from just following the USD trend.
If you would like any analysis of your individual exposures and currencies, please contact us.
This document is for information purposes only and does not constitute any recommendation or solicitation to any person to enter into any transaction or adopt any trading strategy, nor does it constitute any prediction of likely future movements in exchange rates or prices or any representation that any such future movements will not exceed those shown on any illustration. All exchange rates and figures appearing are for illustrative purposes only. You are advised to make your own independent judgment with respect to any matter contained herein.

