FX Markets Update: Term Structure Implies More Movement In the Short-Term

SUMMARY
Throughout 2023 FX volatility has been trending lower amid range bound markets. Volatility reached the lowest level earlier this month and there has been a small rally.
Across all currencies the term structure of volatility has become more inverted (short dates have rallied more than longer dates). The option prices seen in the market imply more movement is expected over the short-term.
ANALYSIS
Throughout 2023 and particularly over the last few months volatility has been trending lower. The chart below displays the trend since April 2023 for the 3-month EUR/USD market (implied) volatility. The reason for the lower volatility has been driven by the market spot movement (the second chart below). Although daily movement has been observed with the news and data releases, the market has been largely rangebound which has driven option volatility lower as a result.
The expected movement of the spot market determines the implied volatility and in turn the option prices. It can be observed that volatility is usually elevated around key market moving events and lower around times when markets are quiet such as holiday periods. A couple of weeks ago post 4th July break, markets certainly had that holiday feel however, since then uncertainty has returned and volatility has rallied.
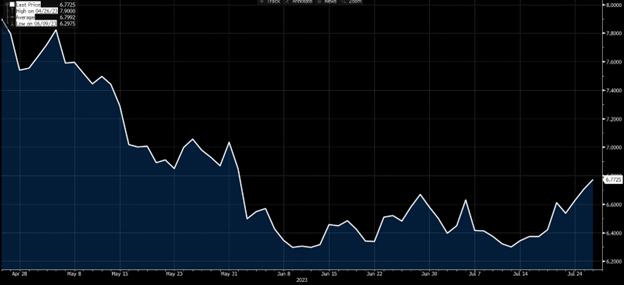
EUR/USD 3-month market traded (implied) volatility since April 2023
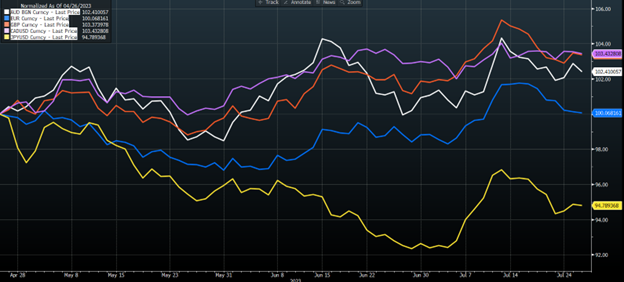
Percentage movement in AUD, JPY, EUR, GBP and CAD against the USD (base 100) over the same period.
It’s worth noting that volatility is not just a single figure it has term structure as the market caters for options of all dates to satisfy those both hedging or for those trading the market. The term structure at the extremes has two forms. Firstly, the term structure can be normal. In a normal curve volatility increases as the time to expiry increases. The second curve is an inverted curve where volatility is highest for short-dated options and then decreases as the time to expiry increases.
AUD/USD
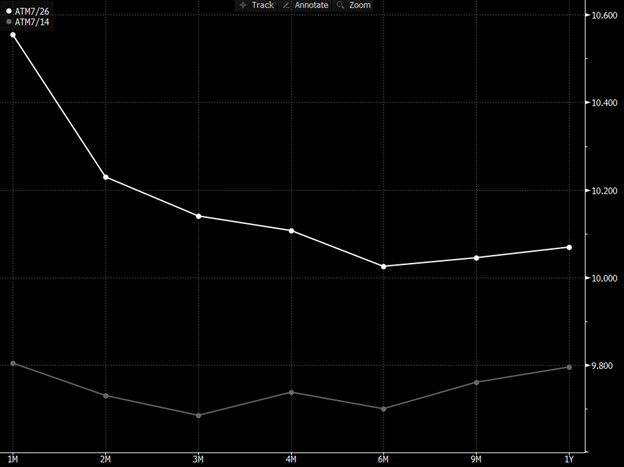
The chart above shows the AUD/USD term structure of volatility increasing and moving from flat to inverted. The lower curve is for 14 July and the upper curve the as of 26 July. AUD/USD is a risk currency and signals that spot movement is expected in the short-term rather than longer-term.
EUR/USD
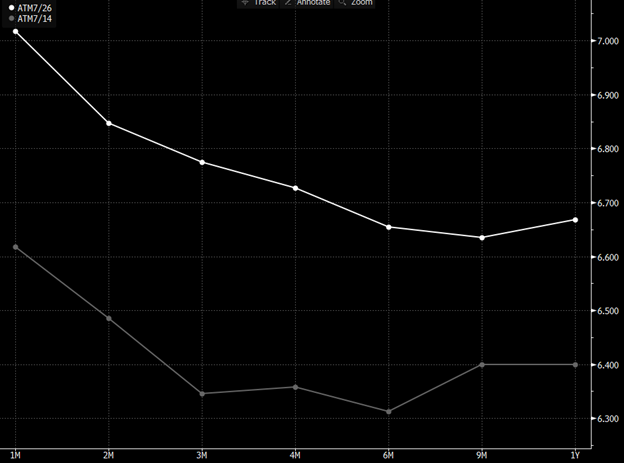
The chart above shows the EUR/USD term structure of volatility increasing. The lower curve is for 14 July and the upper curve the as of 26 July. The shape of the curve in this case has not changed significantly.
USD/JPY
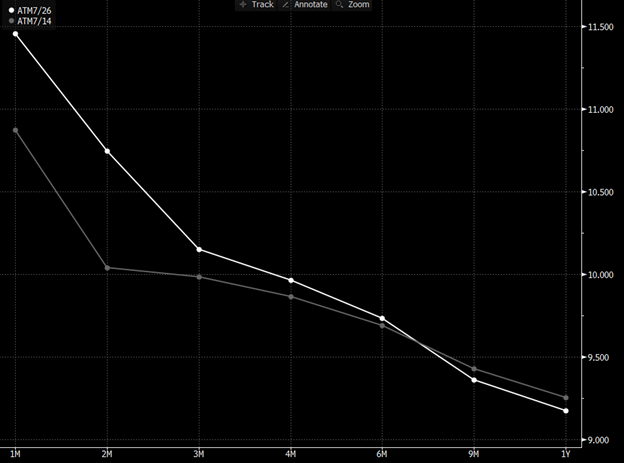
The chart above shows the USD/JPY term structure of volatility increasing. The lower curve is for 14 July and the upper curve the as of 26 July. Demand for shorted dated options has made the curve more inverted.
USD/CAD
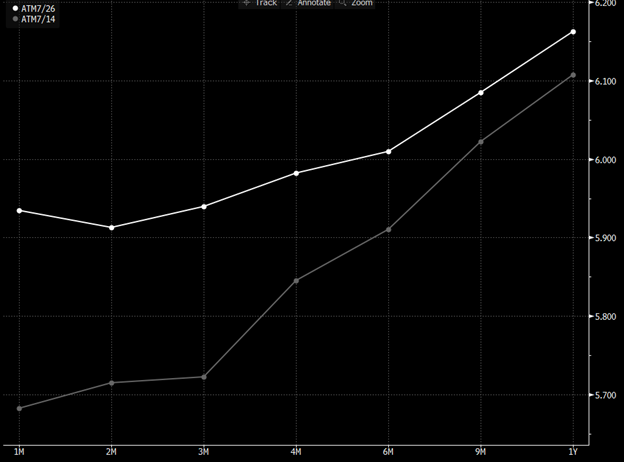
The chart above shows the USD/CAD term structure of volatility moving from normal. The lower curve is for 14 July and the upper curve the as of 26 July. The curve has been quite normal, indicating that movement is expected less in the short term. After the change the curve is almost flat.
GPB/USD
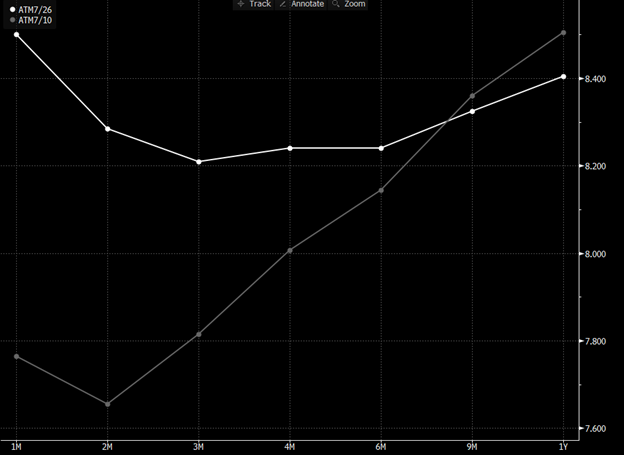
The chart above shows the GBP/USD term structure of volatility increasing and move from normal to inverted. The lower curve is for 10 July and the upper curve the as of 26 July. In this curve longer dated volatility has fallen and short-dates volatility has risen significantly.
CONCLUSION
The analysis of the term structure of volatility across major currencies has indicated that market sentiment has shifted over the last two weeks. Short-term uncertainty has replaced the quiet North Hemisphere summer vibe. The key driver of FX remains the data which in turn alters the expectations of monetary policy. This data will be closely watched as should any open exposures over this period.
This document is for information purposes only and does not constitute any recommendation or solicitation to any person to enter into any transaction or adopt any trading strategy, nor does it constitute any prediction of likely future movements in exchange rates or prices or any representation that any such future movements will not exceed those shown on any illustration. All exchange rates and figures appearing are for illustrative purposes only. You are advised to make your own independent judgment with respect to any matter contained herein.

